
Within the entire palette of services Pioneer Consulting offers to subsea cable system developers or financiers, market studies represent an interesting segment as it regularly leads us to compile, analyze, and play with data.
For benchmarking purposes for a specific market study, we built the chart in Figure 1 below showing the value of the Human Development Index (HDI) as a function of the consumption of international bandwidth per capita for 150 countries around the globe.
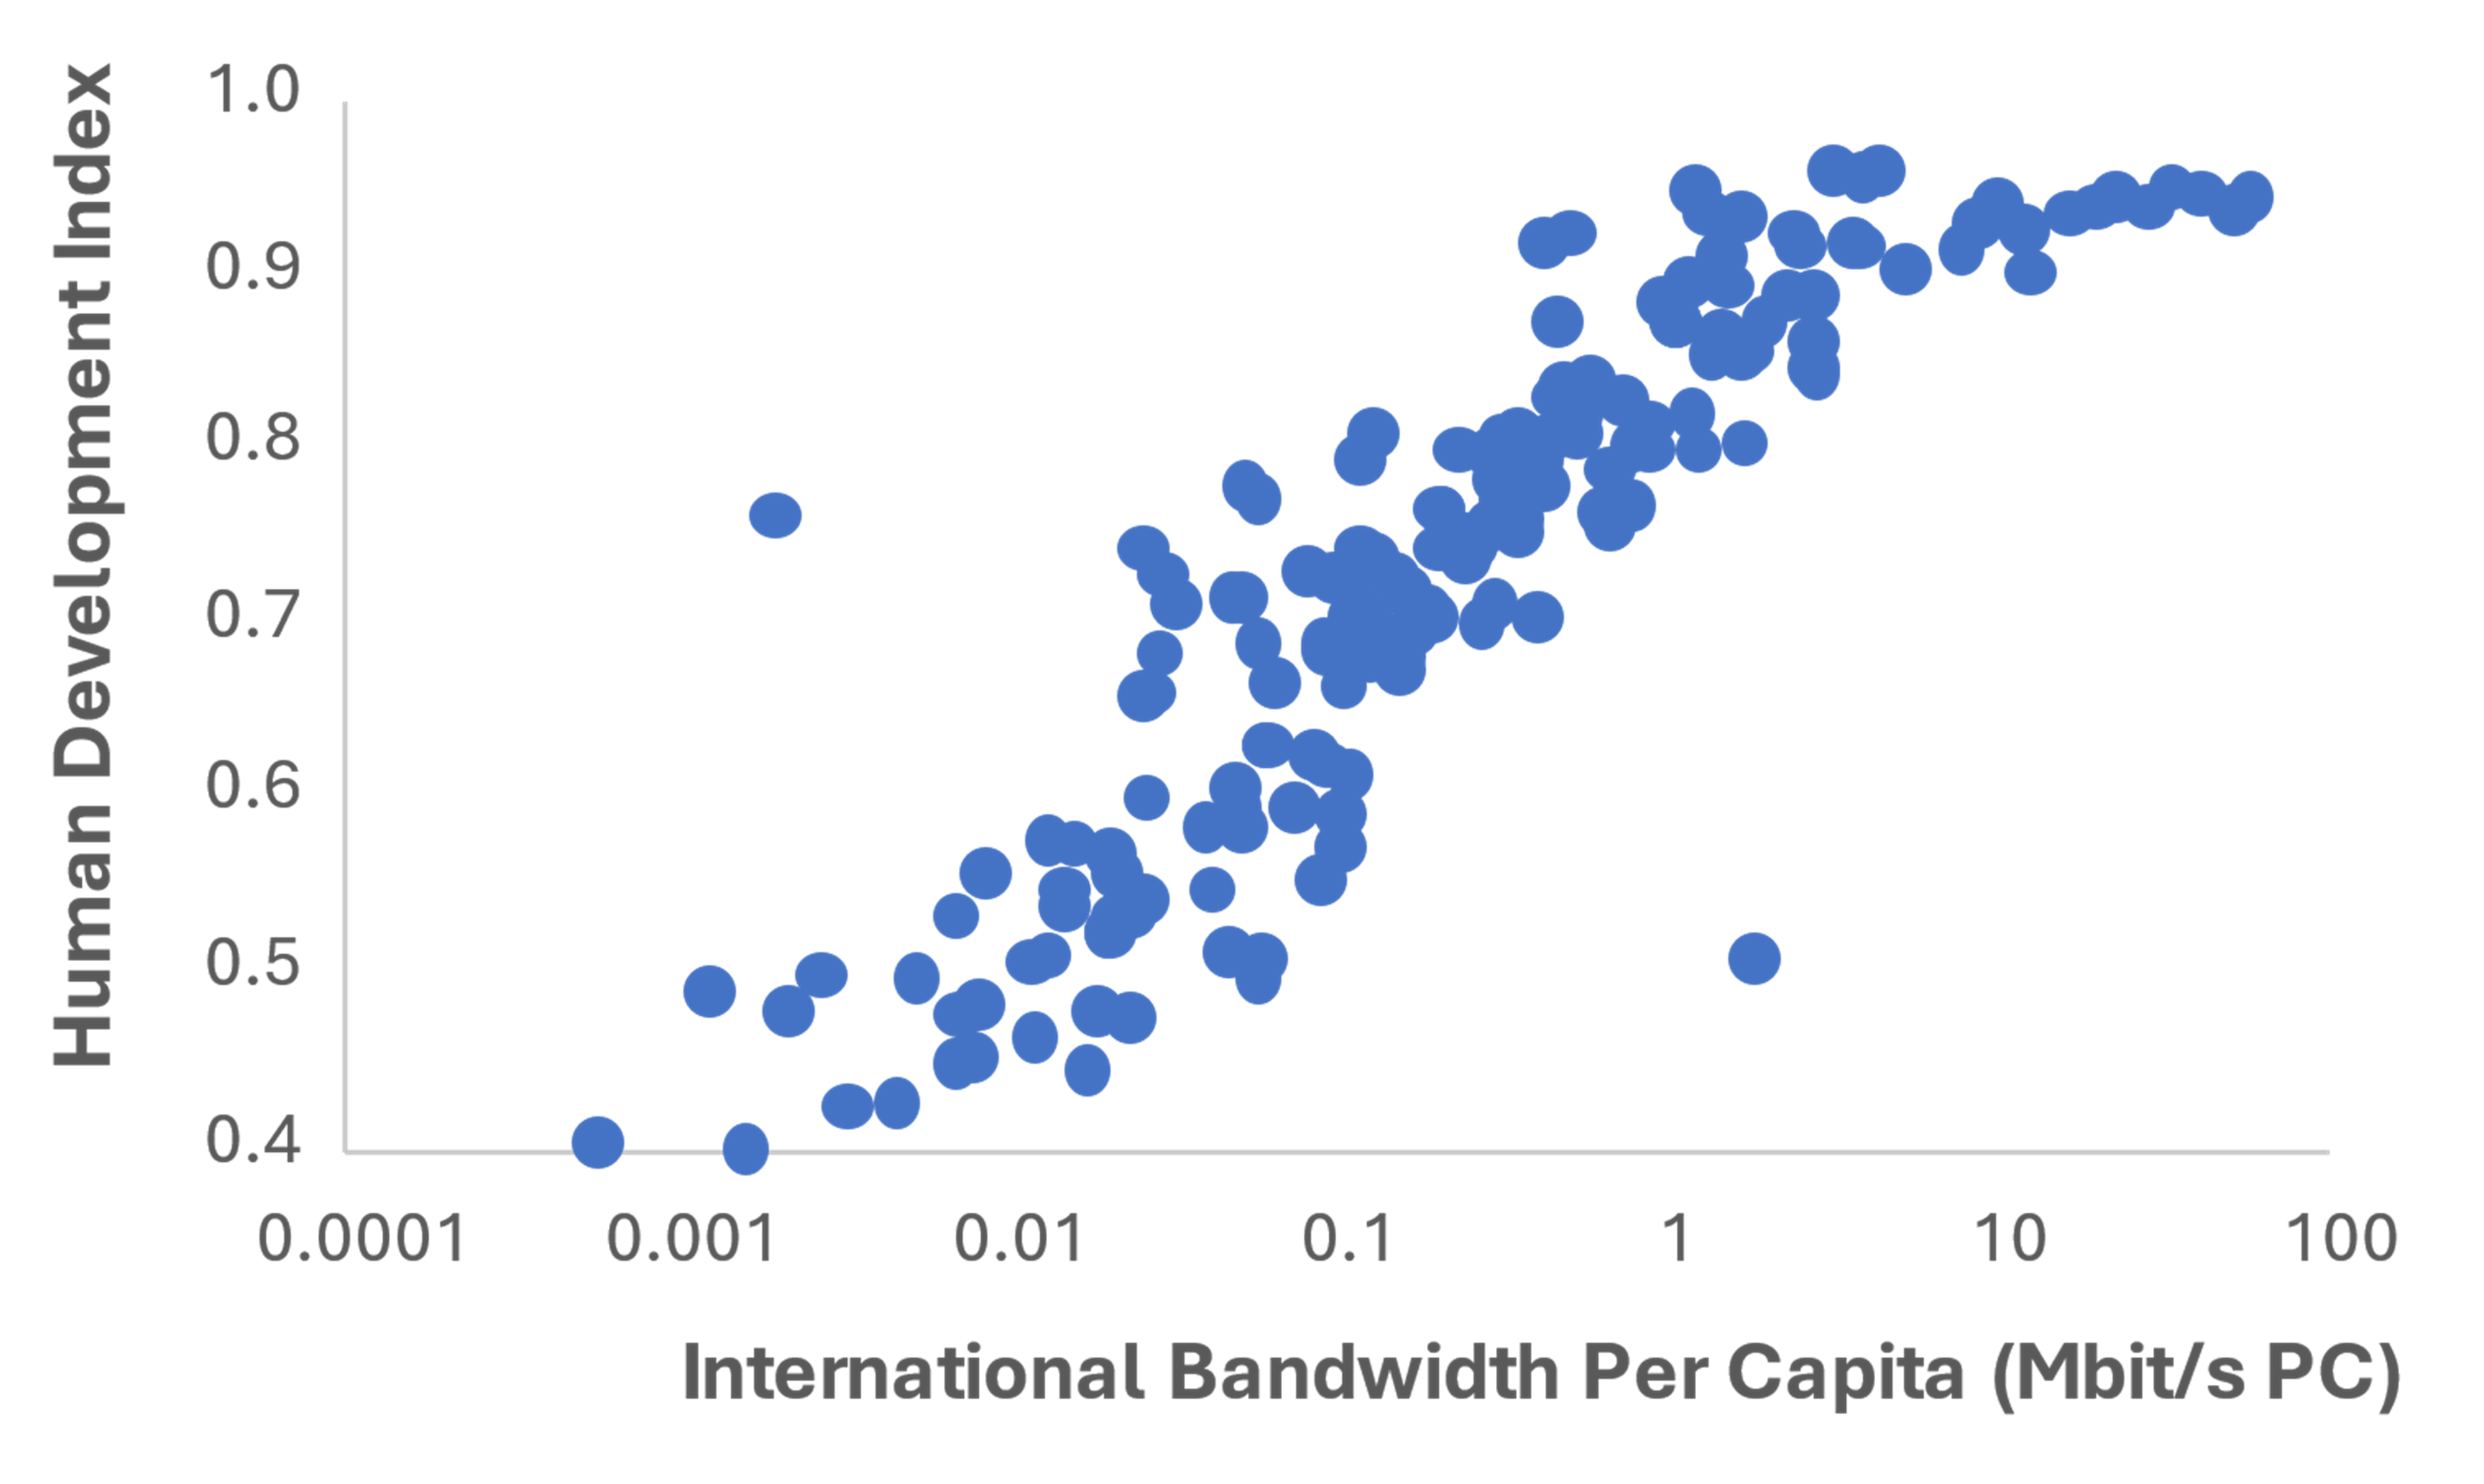
Figure 1: Relationship between the Human Development Index (HDI) and international bandwidth per capita. (Data from 2022. Note, each circle represents a country, and the chart includes 150 countries).
The HDI is a statistical composite index of life expectancy, education, and per capita income indicators developed by the United Nations (UN). By construction, the HDI ranges between 0 and 1, and the higher, the better.
The consumption of international bandwidth per capita is the sum of all international capacity needed by international bandwidth users, including internet backbone providers, content providers, cloud-based service providers, content delivery network operators, enterprises, and research and education networks, divided by each country’s population size. The international bandwidth per capita has been obtained using data from ITU-T, the UN, the market research firm TeleGeography, and Pioneer Consulting’s own market intelligence.
Figure 1 above seems to show a good correlation between both data. As we have read many times, a correlation between two variables, however, does not automatically mean that the change in the value of one variable is the systematic cause of the change in the value of the other variable. Below presents some examples of ‘spurious’ correlation occurring when two variables are correlated but do not have a causal relationship (examples from this excellent website).
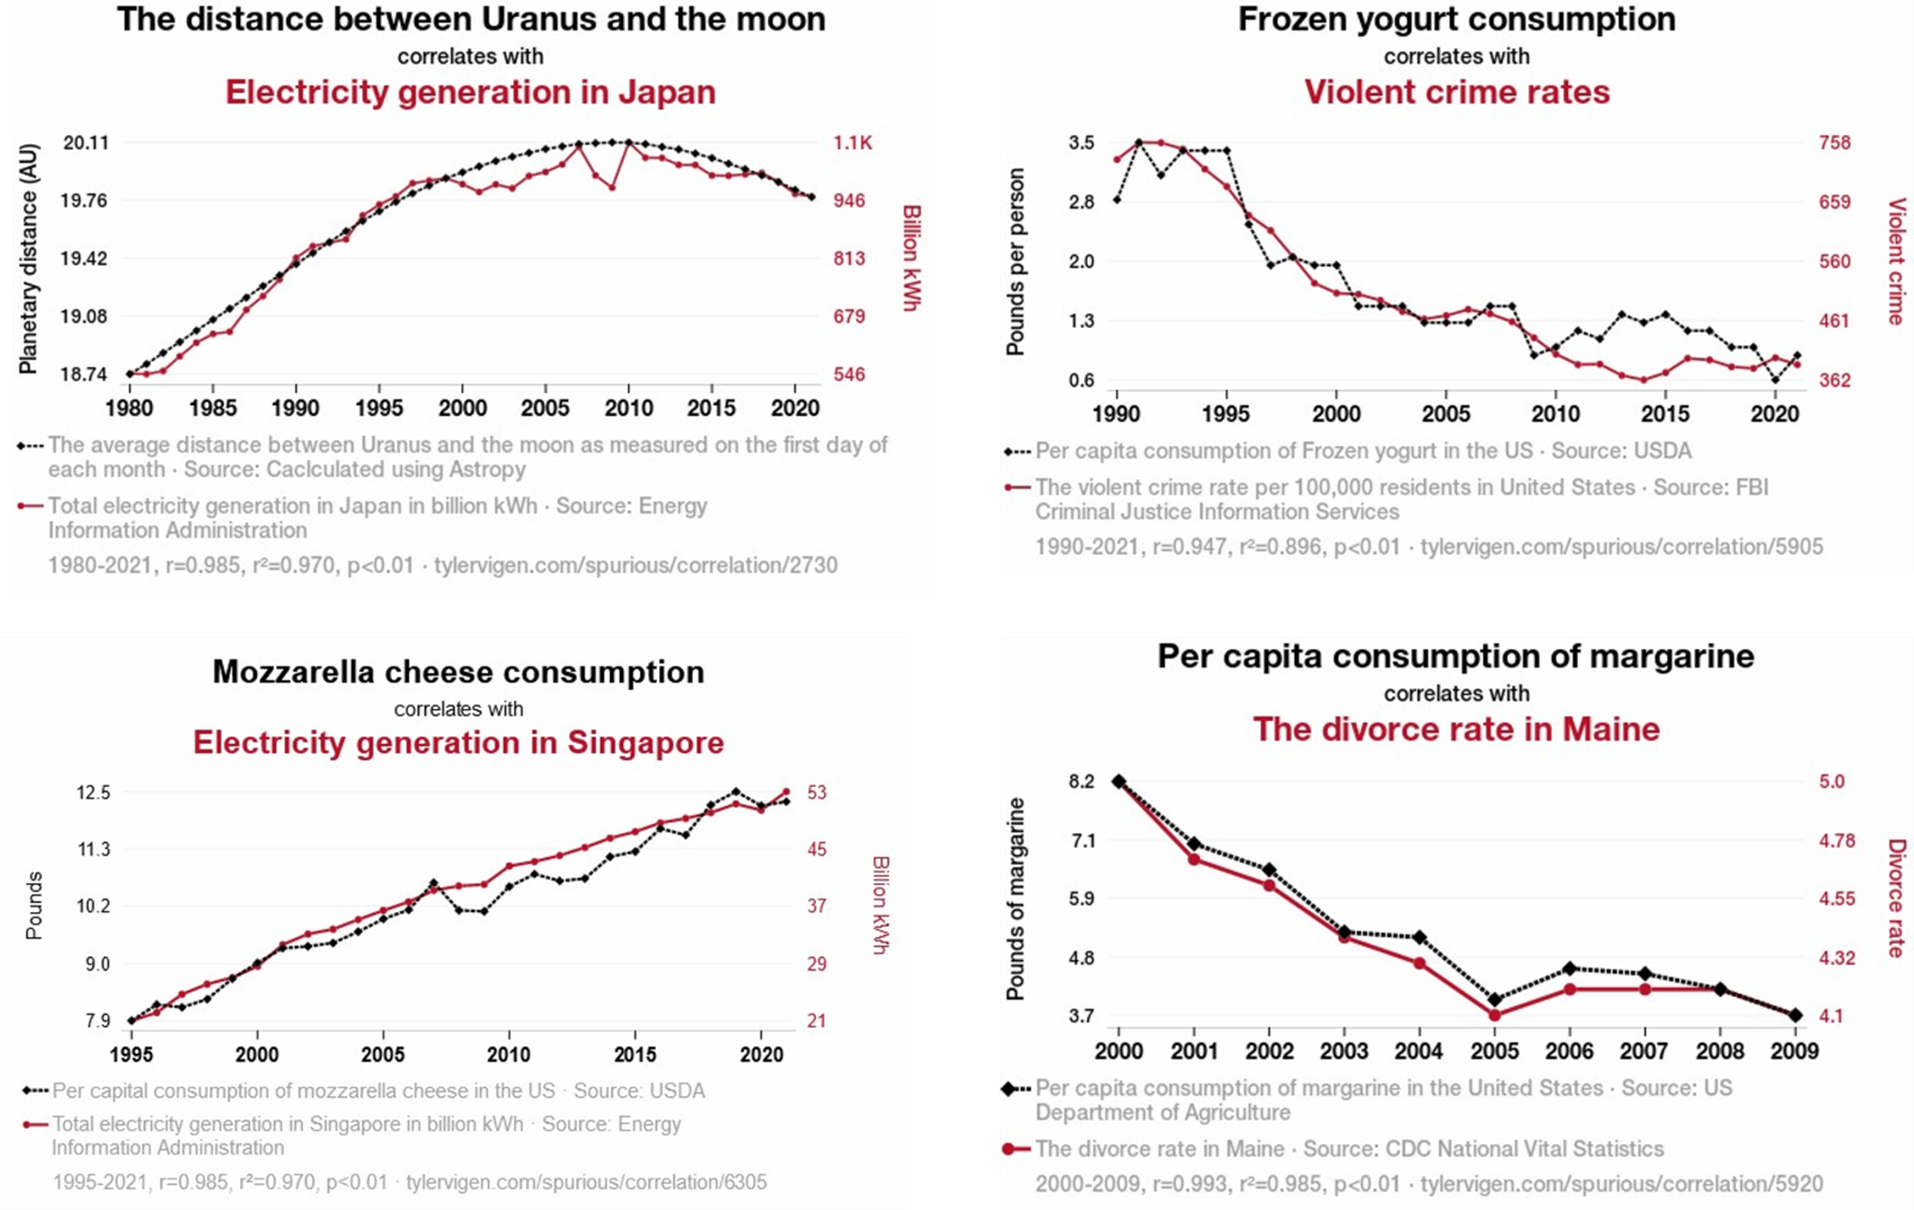
Figure 2: Four examples of ‘spurious’ correlations (https://tylervigen.com/spurious-correlations).
The four examples above show a high correlation coefficient exceeding 0.95 (even reaching 0.99 for the example at the bottom right of Figure 2). However, common sense tells us that, e.g., the level of per capita consumption of mozzarella cheese in the US does not drive the amount of electricity generated in Singapore. Simply put, there is no causal relationship between the two facts. The high correlation in the charts of Figure 2 can be explained by several factors, including chance or graphical manipulation (e.g., by adjusting graph vertical scales). More details about the reasons that may cause a spurious correlation can be found here.
So, let’s move back to our original Figure 1. There is a reasonably high suspicion of causation, and not only correlation, between the combined health/education/economic indicator (HDI) and the consumption of international bandwidth per capita. On one hand, the higher the level of life, the more prone – because they have money and time – individuals are to consume services and applications requiring international bandwidth. On the other hand, the larger the level of international bandwidth made available to the individuals, the more numerous the opportunities to learn, have access to telemedicine and develop business. This is supported by the numerous assessments of the economic impact of subsea cables on the landing country (assessment usually supported by cable developers). The high suspicion of causation is also supported by the fairly large number of countries (150) and the verticals axes that have not been manipulated (both start from 0).
Figure 1 presents two dots out of the cloud. Out of the countries shown below in Figure 3, Cuba has a relatively high (above the average) HDI due to a social system inherited from the communist times associated with a super low consumption of international bandwidth caused the telecom embargo imposed by the US. This level of international bandwidth consumption may change (increase) with the recent ARIMAO cable connecting Cuba and Martinique since 2023. The other dot out of the cloud is the country of Djibouti: a very important telecom hub where virtually all the subsea cable systems connecting Asia and Middle East to Europe land with apparently little social and economic benefits for the local population (resulting in a HDI significantly lower than the average).
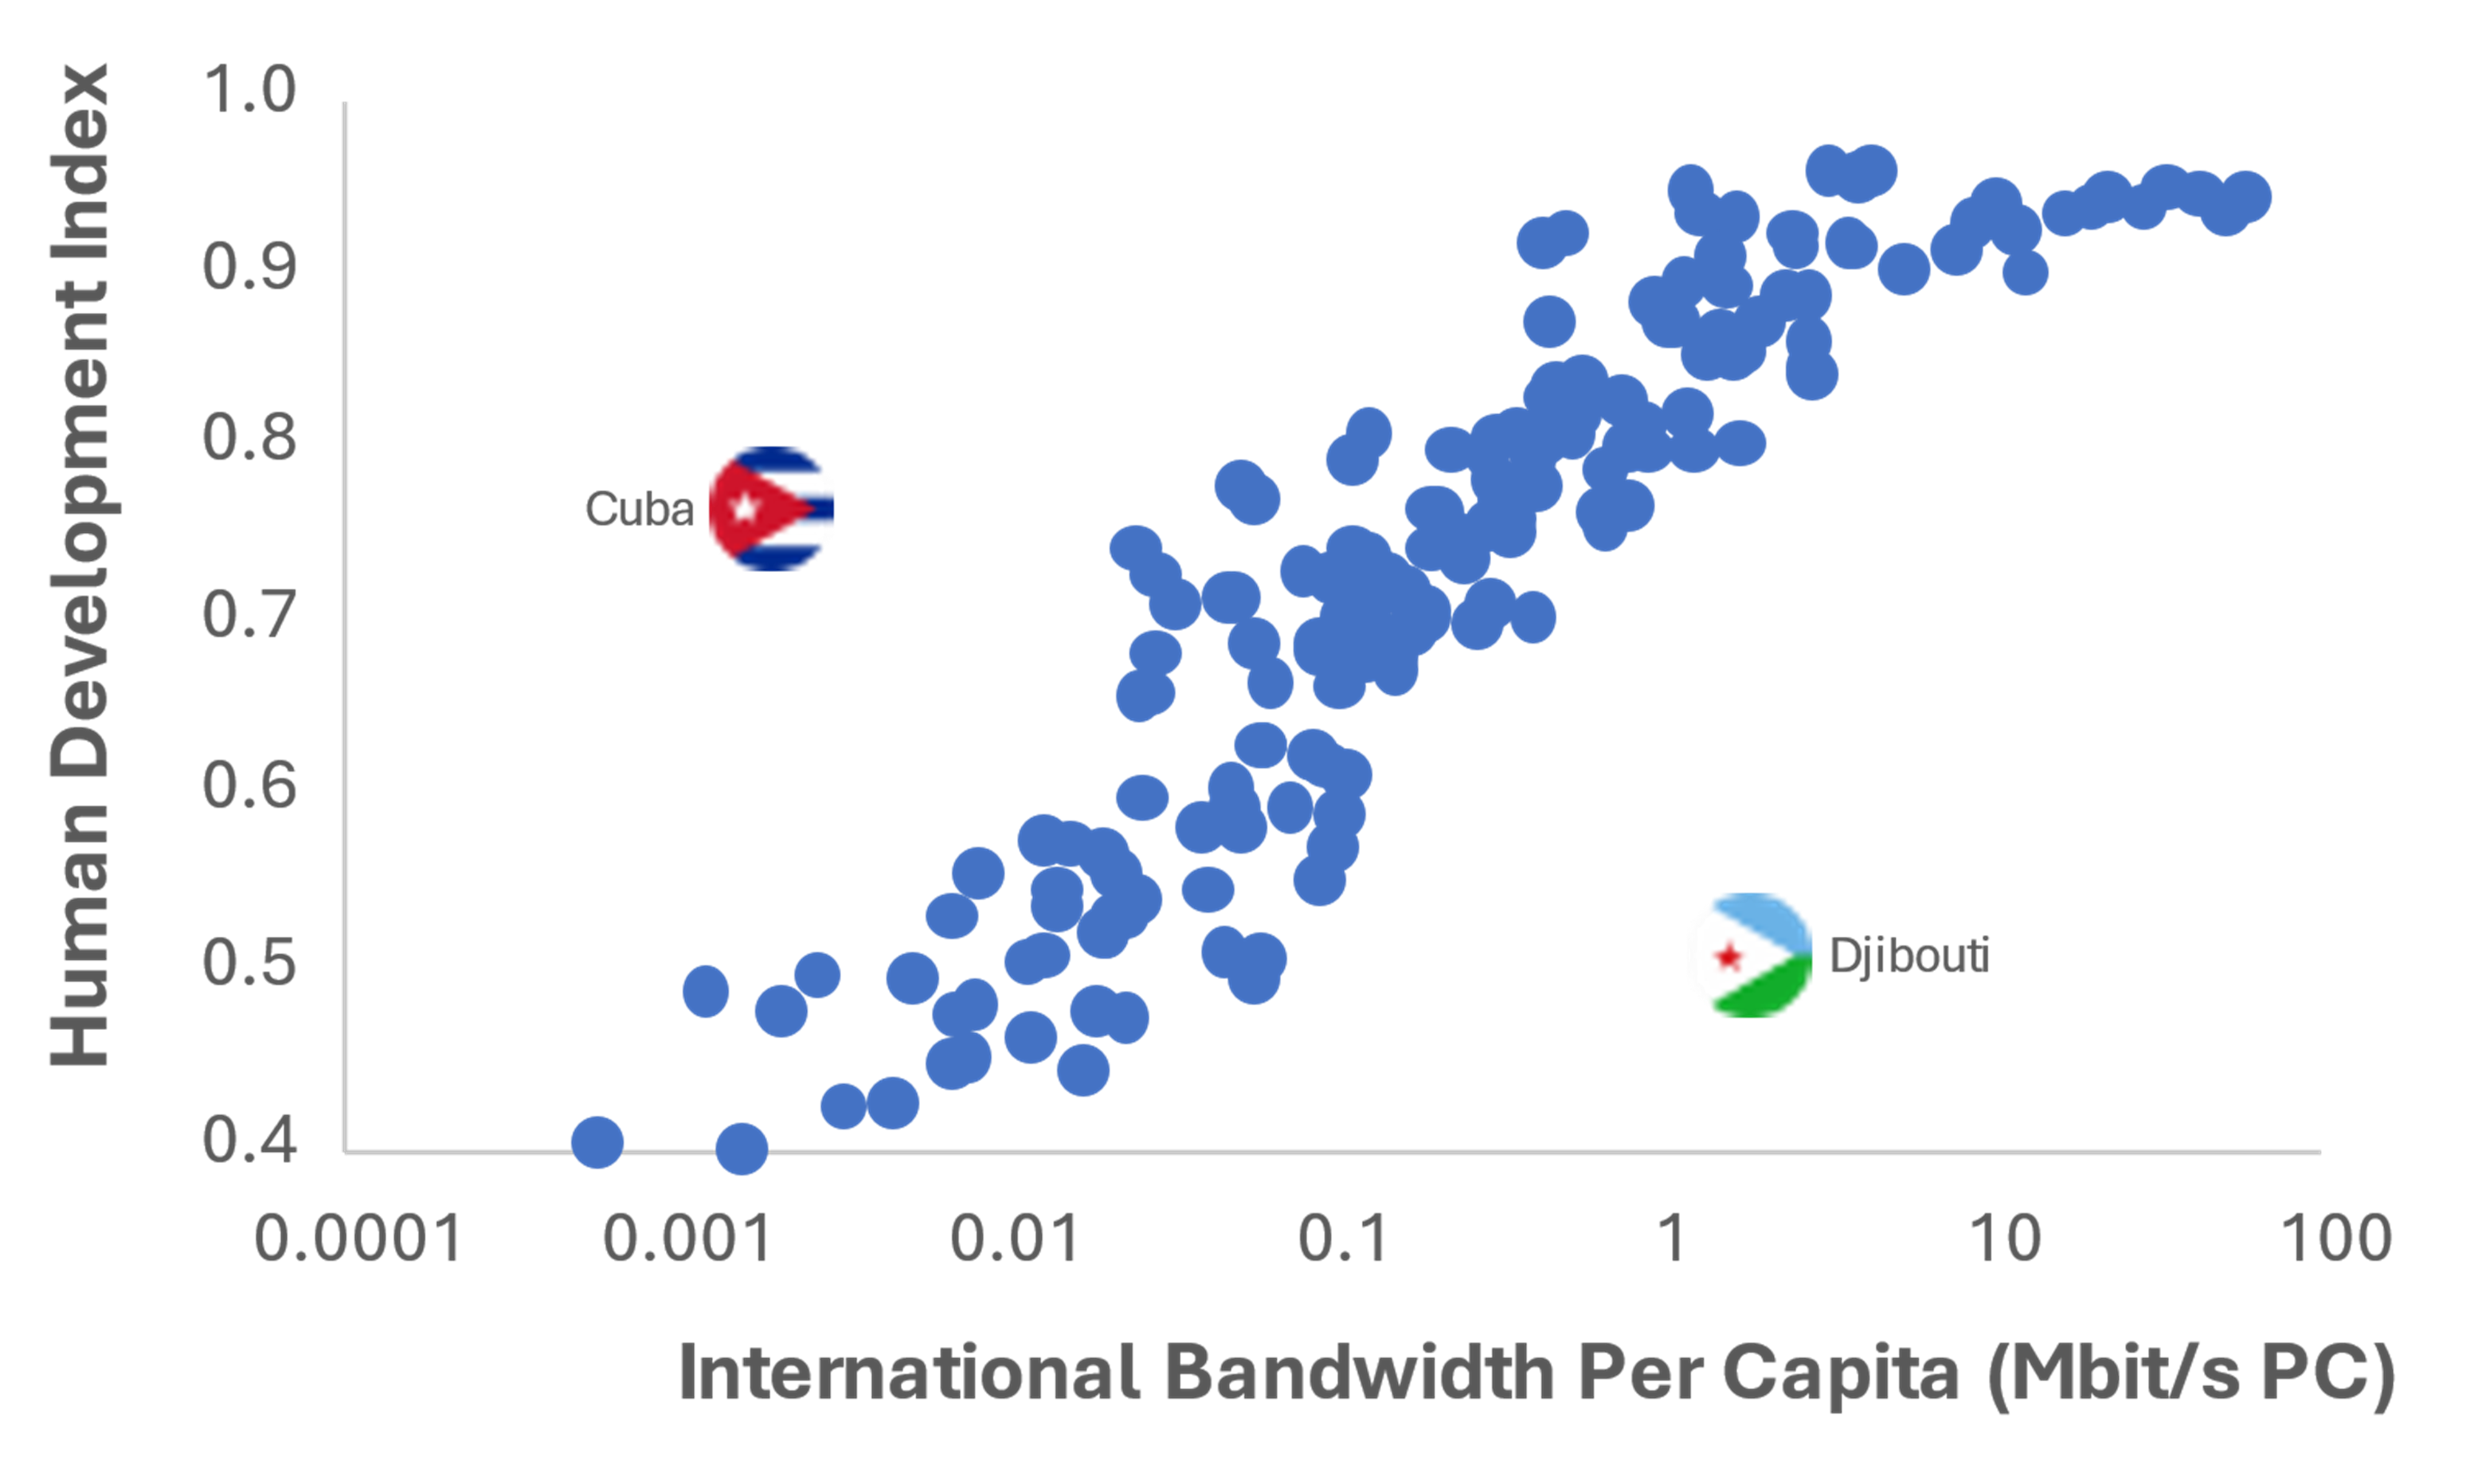
Figure 3: Cuba and Djibouti positions.
In the last figure, I added for reference the countries where Pioneer Consulting has a physical presence (namely, USA, UK, France, UAE, and Philippines – apologies to my colleague Iain Ritson because I could not find specific data for Scotland. Also added, is the country with the highest HDI (Switzerland), and the country with the highest international bandwidth per capita (Ireland).
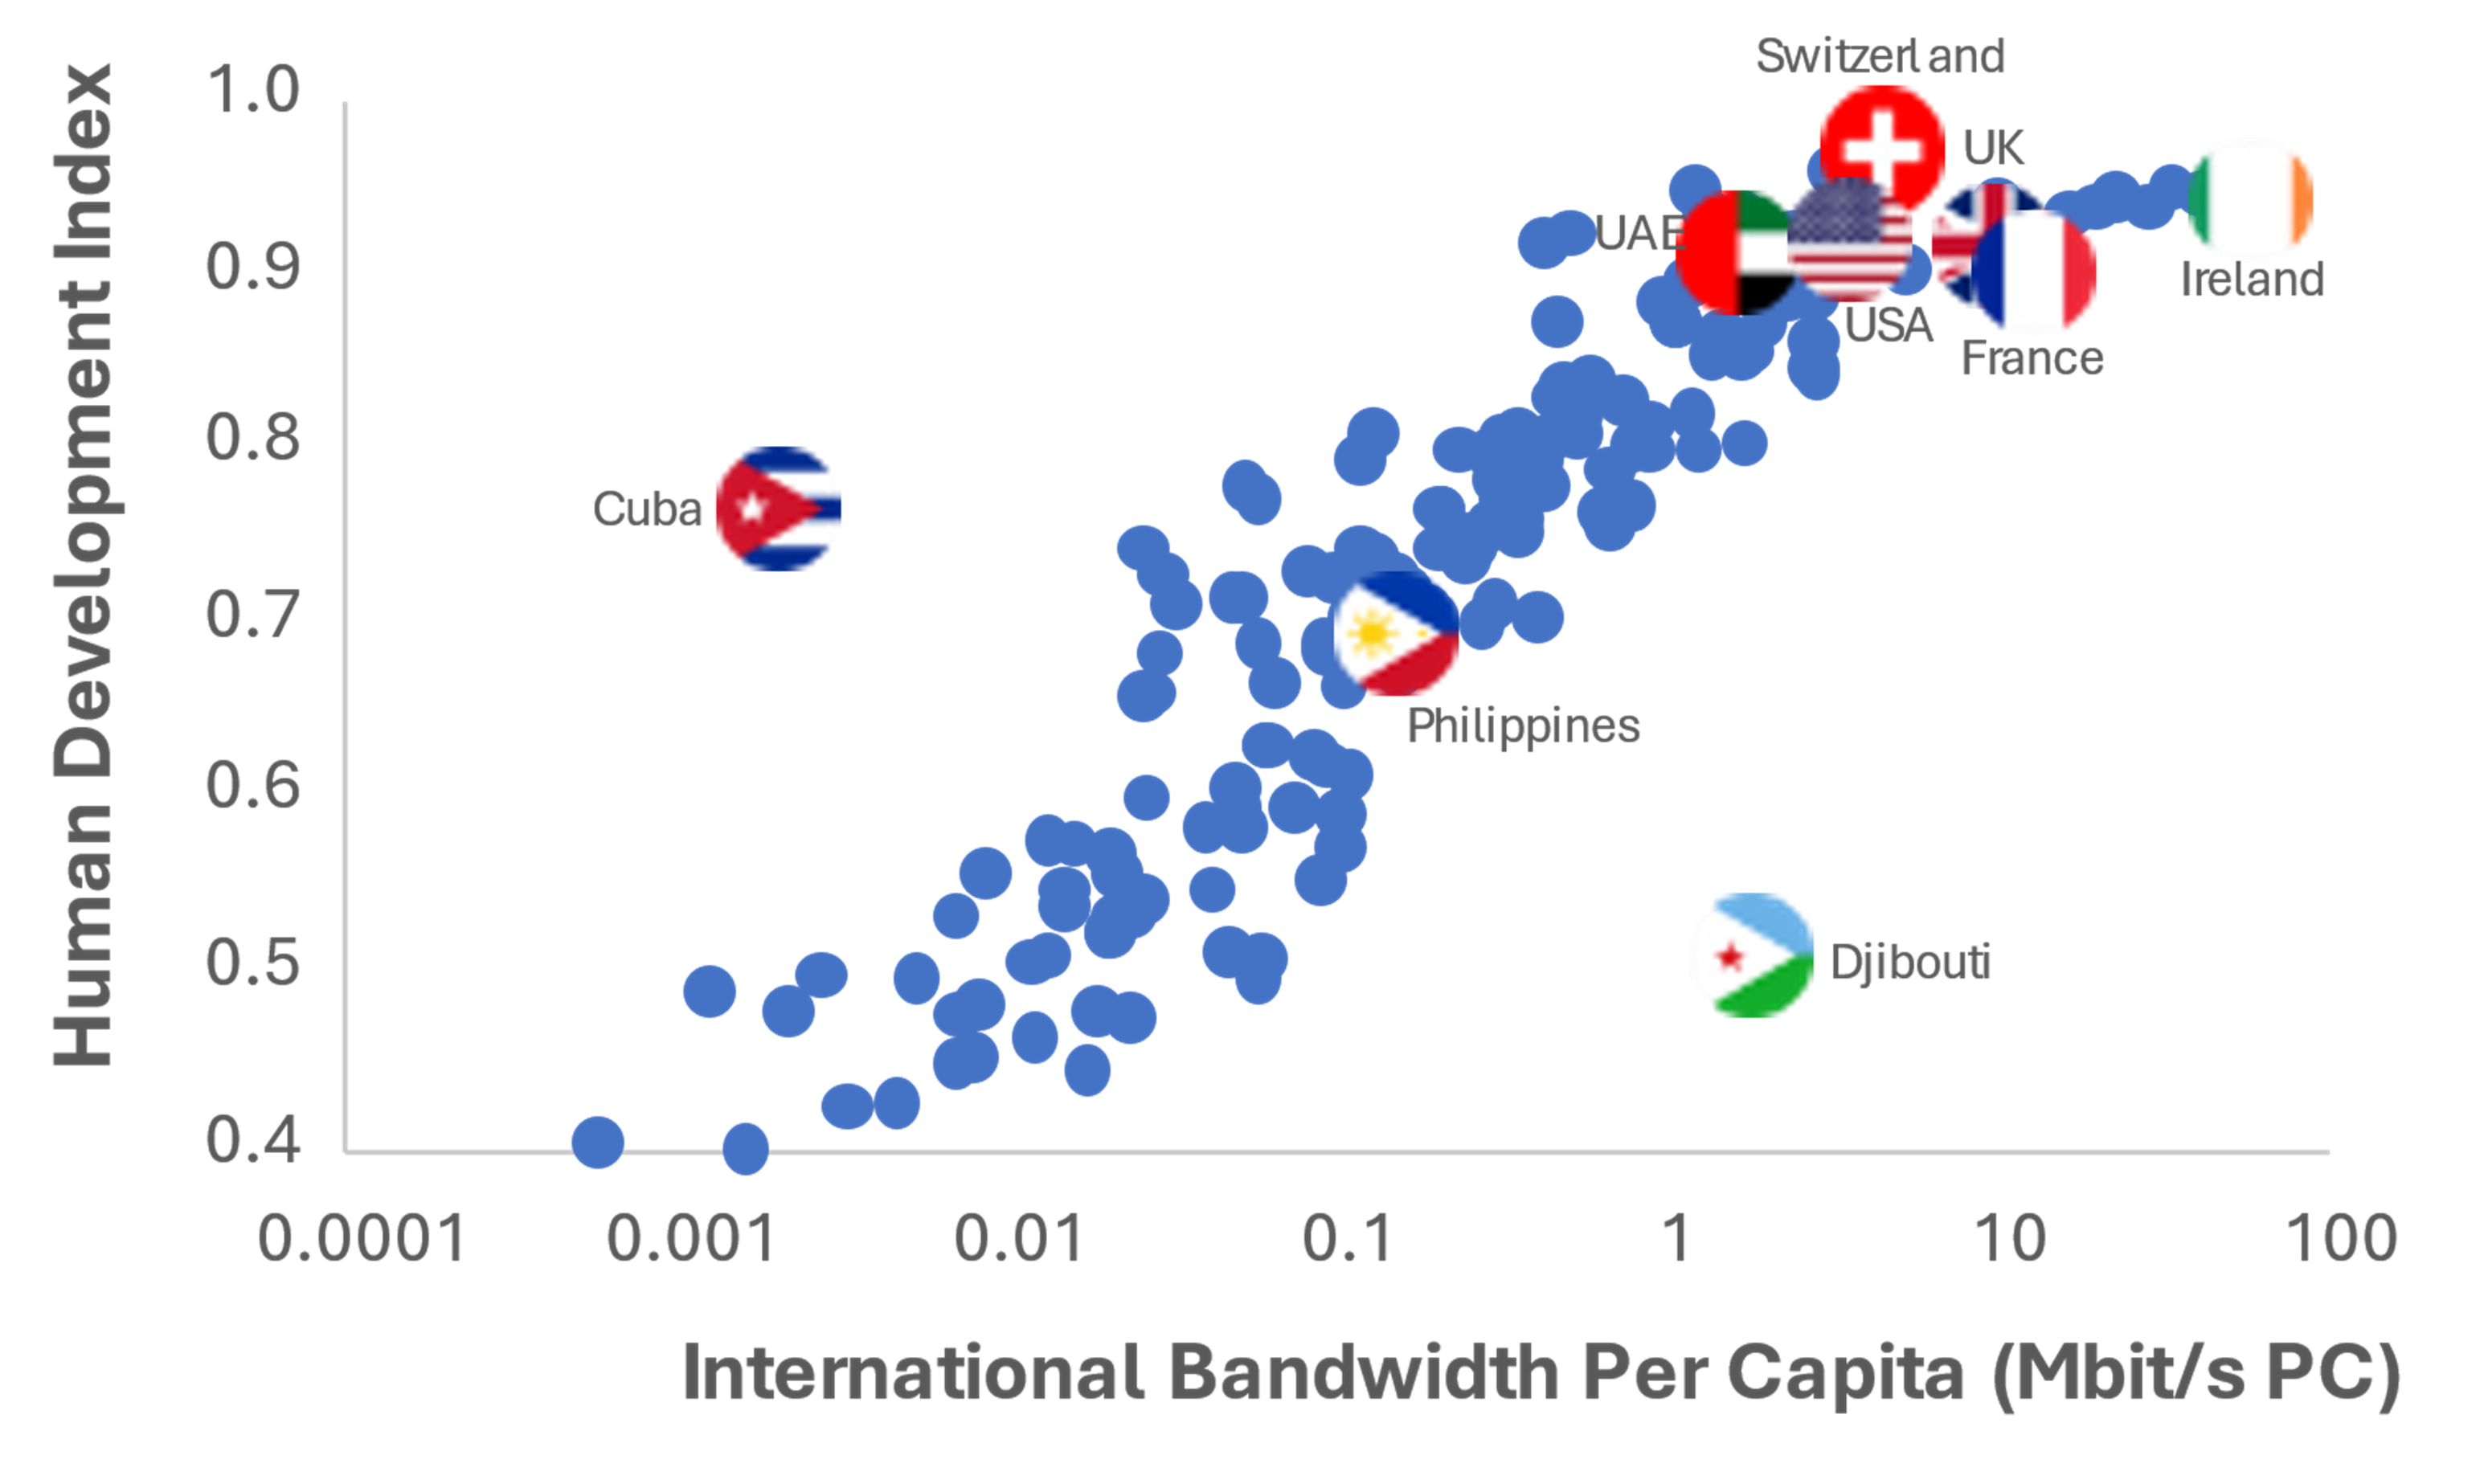
Figure 4: Additions of countries where Pioneer Consulting has a presence (plus country with the highest HDI (Switzerland), and country with the highest use of international bandwidth per capita (Ireland).
Another strong condition to establish causality is temporal sequencing — X must come before Y. Higher levels of development may come after an increase in the supply and consumption of international bandwidth in some countries. In other countries, it can be the opposite. Understanding causality between both variables requires detailed, multi-disciplinary, and independent studies on a per country basis.
For comments or questions, please contact us via [email protected].